Gantt Chart (Bar Chart) is a useful and essential tool for planning and scheduling construction projects. This is a common technique used by project managers or quantity surveyor for scheduling construction activities.
To fully understand what a Gantt Chart is, it’s important to go over what it is, why it’s needed, where people can go to create a Gantt Chart, and the aspects listed in a Gantt Chart. All of which outline the necessity for a Gantt Chart during a construction period.
Using Gantt chart helps to ensure that the project schedule is maintained at a reasonable pace. The individual tasks that make up the work breakdown schedule logically progress in a manner that moves the project closer to completion.
What is a Gantt Chart?
Gantt Chart is a type of bar chart used to illustrate a project schedule, including start and finish dates of activities and a summary of activities of a project. Bar chart represents how a contractor can plan construction activities including ordering supplies, scheduling subcontractors, and completing job-related administrative tasks.
In simple terms, a Gantt Chart is something used when planning and designing a construction project. It’s essentially a bar chart that is used to outline details of a construction project such as when it the project needs to be started, finished, steps, and activities surrounding the entire process.
Since construction projects can be so complicated, each step of the entire process needs to be outlined perfectly. Hence why Gantt Charts are so popular in the business.
They’re used in all types of construction projects such as home construction, residential construction, commercial construction, industrial construction, and much.
Basically, a Gantt Chart in construction is a visual representation of all of the tasks scheduled over an entire timeframe for a construction project.
Why is a Gantt Chart Needed?
As noted, Gantt Charts are a necessity for a construction project. The entire process can be overwhelming for most and without the proper outline, a person will feel even more overwhelmed than normal.
Properly implementing a timeline, budget framework, and steps are what a Gantt Chart typically highlights. All of which play an important role in the entire process since all of them are needed for a construction project.
Besides the ability to plan the rest of a project, a Gantt Chart is important to demonstrate to the construction team and the client themselves when each step will be completed. Something everyone involved in the project will want to know.
Constructing anything is expensive, and the fact of the matter is that people need a reasonable plan for every step of the way.
A Gantt Chart is used to help a construction team and if the software doesn’t work properly, then it’ll only cause more harm than good, which is why it’s important only to get an affordable software, but something that will work properly.
Where Can You Create a Gantt Chart?
There are a ton of resources online for people to use in order to create a Gantt Chart. Some of which are completely free and easy to use.
One of the most common ways to create a Gantt Chart is right in Microsoft Excel. It’s simple, easy, and already installed on most computers.
Other than excel, websites like smartsheet.com, asana.com, hive.com, and projectmanager.com are some of the top websites for creating online. All of them have different advantages over one another.
Before someone decides on what software they should use for a Gantt Chart, it’s important to do some proper research behind each one. It would be a shame if someone were to spend money a specific software to only find out it doesn’t work on their computer.
However, a person shouldn’t feel the need to spend a ton of money on a Gantt Chart software. If a person can find free software that gets the job done, then they should consider utilizing it to make a Gantt Chart.
Despite this, a person shouldn’t look for the cheapest option. Cost and effectiveness are the two most important aspects to consider for a Gantt Chart. Both of which can be easily looked at.
Aspects in a Gantt Chart
As noted, to fully understand a Gantt Chart it’s important to go over the individual aspects of a construction project that are listed in a Gantt Chart. In no particular order, down below is a list of common construction project aspects that are in a Gantt Chart and the aftermath of a Gantt Chart publication.
1. All Phases
In every Gantt Chart, all phases of a construction project are listed. Such as the resource acquirement, processing of resources, construction itself, completion, and the future of the finished project.
These phases are most highlighted to people in the construction team and clients of the project so that everyone understands the schedule behind each phase, such as when a specific phase should be completed and what’s expected behind the phase.
2. Individual Tasks
Other than the major phases, every operation has a specific individual task. Since a construction project has so many moving factors, every single factor has an important task ahead of them.
These are the main reasons why every construction project needs a highlight of each individual task. If a specific moving part doesn’t know what to do, then they might change the outcome of the entire phase.
3. Milestones
As one might expect, milestones play an important role in a construction project. Milestones are done in several fashions and there are smaller and larger milestones for every project.
Daily, weekly, monthly, and yearly milestones are all attributed to a construction process. Aspects that are usually brought up in a Gantt Chart to highlight to a construction team and the clients behind the project on what they can expect.
4. Task Dependency
Just like everything in life, certain tasks might not be able to get done until another task is accomplished. Meaning that specific tasks need to be completed before another phase of the entire operation can be done.
This is called task dependency and is often highlighted in a Gantt Chart. In simple terms, you can’t make a peanut butter and jelly sandwich until you have bread. Once you have bread, you need peanut butter and then jelly to complete the operation.
5. Gantt Chart Publication
Once a team or person is confident in their Gantt Chart, they will email or print copies out in order to publish it. Doing this will allow the team or person to present what they think the best route is surrounding the entire execution of the construction project.
Something that is heavily talked about in the construction business: what is the plan and when can we expect certain phases to be done?
6. Discussion Surrounding the Gantt Chart
Once a team or person has the Gantt Chart for the specific construction project, they might meet with other team members, clients, and city officials to see the entire process.
They then might take recommendations or realize a mistake once the Gantt Chart is completed.
7. Changes and Execution
Once it’s completed and they’ve met with everyone they needed to meet with, the people behind the Gantt Chart will either go back and make adjustments or execute the plan.
Once the plan begins to be implemented, mistakes are more than likely going to come up. Meaning that the Gantt Chart will change over time.
How to prepare a Gantt Chart for Construction Project
The Gantt chart lists the construction activities or tasks which need to performed down a single column. A second column is indicating the length of time to complete each activity is often add. At the top of the chart, dates for the construction projects notes in the horizontal row. To the right of each activity, a line, or bar is draw from starting date to the completion date for the activity.
All activities in the first column are made in this manner across the rows of the chart, with the bar for each activity beginning at the earliest possible starting date. Many activities must be completed in sequence, requiring the completion of one activity before the next can be started. Some tasks are completed independently.
The chart is used to establish a precedence network that determines the priority level of each task associated with the project. At the same time, the chart also evaluates the dependency relationships of each of the tasks. Together, these two aspects of the Gantt chart make it possible arrange and project the completion time of various tasks in a manner. It shows a logical progression toward the successful completion of the project.
Example of a Gantt Chart for a Residential Construction Work
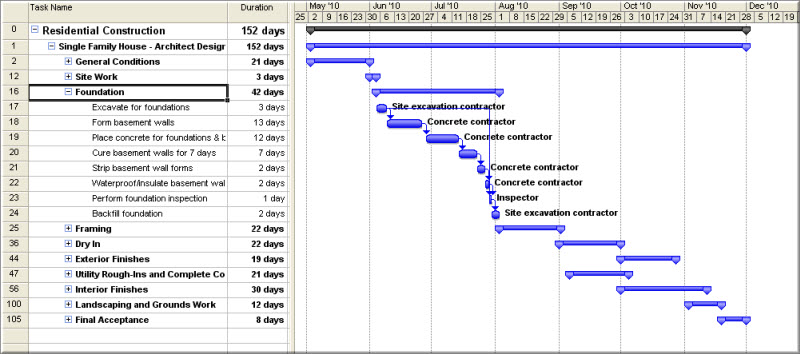
In most cases, the Gantt chart appears as a horizontal bar chart. Each task associated with the project is accounted for on the body of the chart. Because the Gantt chart is concerned with executing the project in the most efficient manner. This also helps to define the amount of time required to complete each individual task. The chart also helps to define tasks that can complete concurrently and which tasks cannot address until other tasks are fully complete. This function helps to project both the sequence and the duration of each task involved in the project.
What is the Gantt Chart Advantages? Using a Gantt chart offers the following advantages:
- Project managers are using bar charts to represent phases and activities of a project so they can be understood by a general audience.
- It can be useful to indicate the critical points on the chart with bold or coloured outlines of the bars.
- An updated Gantt chart helps manage the project and head off schedule problems.
- Computer software can simplify constructing and updating a Gantt chart.
- You don’t really need specialised software to build a Gantt chart as it can be easily prepared using Excel or similar software.
A bar chart can be used for just about any type of project, from laying out a marketing strategy or planning a building project.
When to Use Gantt Charts
Gantt charts have a variety of uses among construction professionals. The manager can use Gantt charts under the following circumstances.
- To communicate plan or status of a construction project.
- For monitoring tasks within a project.
- When putting together a simple proposal for a small project.
- To express the sequence and duration of specific tasks or process from a construction project,
- To demonstrate which tasks depend on completion of previous tasks.
A contractor can draw a simple Gantt chart by using a pencil and a sheet of graphing paper. Or can develop more complex charts by using the Excel templates and computer scheduling programs available. Advanced scheduling software can generate an entire chart that helps contractor provides information about the sequence of the activities.
Conclusion
A Gantt Chart is a necessity for any successful construction project. They’re easy to create and great for highlighting what needs to be highlighted for an entire construction process. Doing so will allow a construction team to present important information to each other and clients.